The global collection and reliance on data is growing at a staggering rate with no indication of slowing down. Extracting knowledge and insights from this data in its various forms to solve problems is the main goal of every data scientist. This goal is accomplished by modeling the trends in the data to either understand what factors lead to the generation of particular data (i.e. understand the nature of the data for scientific discovery) or to predict future outcomes. However, because these goals are broad in definition, there is no set procedure or magic bullet that will result in successful modeling for any dataset. Fortunately, there are a number of different models a data scientist can use to gain as much information about the available data.
To illustrate how a data scientist utilizes models to solve real world problems, let’s consider how a construction worker might tighten a screw with a particularly exotic drive design. The first tool our construction worker pulls from his tool bag is a hammer and it does not fit the grooves of the drive design at all. Thus, nothing really happens when he tries to tighten the screw with the hammer. This does not mean hammers are useless. They just aren’t the right tool for this job. So, he puts the hammer down and grabs the next tool, a flathead screwdriver. The shape of this tool loosely fits the drive design and the screw does turn for a few rotations, but the screw is by no means tight. The flathead screwdriver performed better than the hammer, but it is still not the right tool for this job. Our construction worker grabs the next tool to try from his bag, a phillips head screwdriver. This tool fits the grooves of the drive design better than the flathead screwdriver and therefore is able to tighten the screw a little further, but there is still room for the screw to be tighter. The construction worker repeats this process until the tool is found that tightens the screw the most. At that point, the job is considered complete and the construction worker moves onto the next task, which may or may not require the same tool.
Based on this example, each type of model can be thought of as a tool in a bag that a data scientist would bring to a job site. Various models are applied to try to explain the data and their performance on the task is compared to select the best one. Once the best type of model for the task is identified, it can be further tuned by modifying certain aspects of its algorithm to increase its performance. In data science terms, modifying certain aspects of a model is called hyperparameter tuning and it is similar to how the construction worker in our example changed the shape of the screwdriver he used until he found the shape that fit the drive design the best.
Now that the construction worker analogy has built the foundation (pun intended) for our discussion of the model selection process, the remainder of this article will focus on the questions and obstacles data scientists face during this process.
Model Selection
The first two questions a data scientist must be able to answer before beginning the modeling process are: What type of problem am I trying to solve? and What type of problem can I solve, based on the data? Firmly understanding the problem and the data is the quickest way to narrow down what class of models might work best. If labels are present within the dataset (i.e. known outcomes based on the values of the features in the data set), supervised learning models, such as regression or classification, may be the best approach to take. If the dataset does not include labels for the target, unsupervised learning models, such as clustering, should be considered. The table below provides a basic outline for deciding what family of models to use based on what type of problem you are trying to solve and what your data looks like.
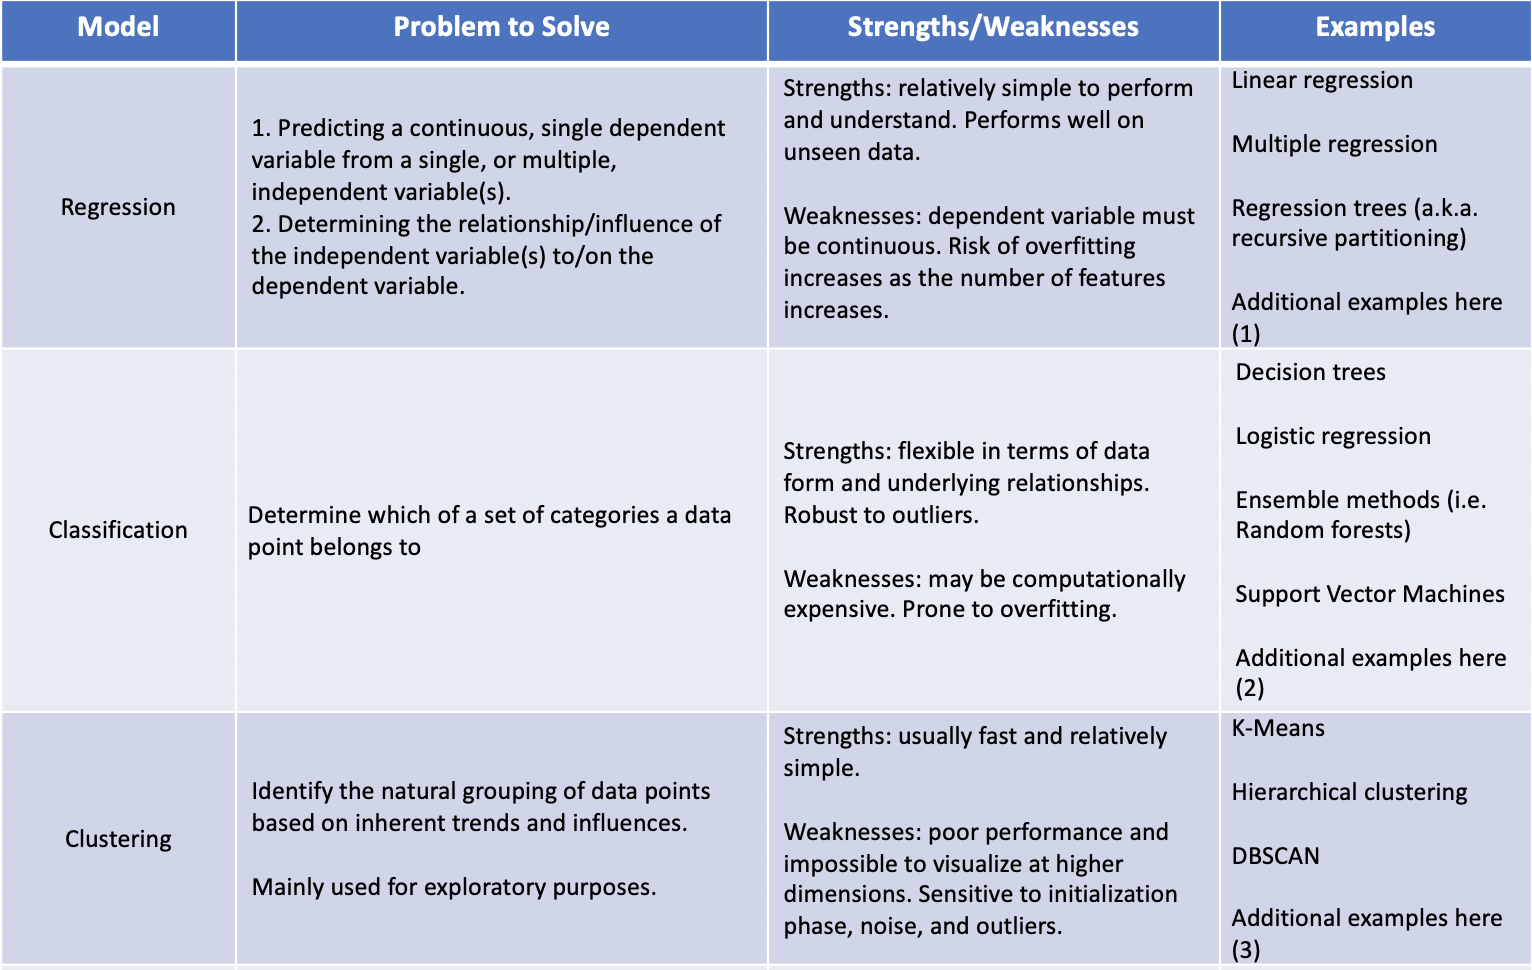
(1) https://towardsdatascience.com/5-types-of-regression-and-their-properties-c5e1fa12d55e
(2) https://medium.com/@Mandysidana/machine-learning-types-of-classification-9497bd4f2e14
(3) https://towardsdatascience.com/the-5-clustering-algorithms-data-scientists-need-to-know-a36d136ef68
Model Tuning
As hinted in the table above, overfitting and dimensionality are two of the main concerns when building a model. The performance of most models will improve as more features are included to help explain the data. But, the inclusion of too many features creates a model that has learned the data it has already seen too well and thus does not perform as well on data it has never seen. Data scientists would deem this an overfit model and state that its ability to interpret and adapt to future data is poor. Additionally, the dimensionality of the data increases as the number of features increases. Higher dimensional data lead to something called the “curse of dimensionality,” where the density of the sampled data grows increasingly sparse as the dimensionality increases. This results in fewer observed data points within each sector of the high dimensional space for the model to train on and a greater amount of empty space for which the model has to extrapolate. This leads to a model that is basically taking a wild guess when it sees new data that falls in these empty spaces.
Fortunately, overfitting and the curse of dimensionality can be ameliorated by hyperparameter tuning and principle component analysis (PCA), respectively. Hyperparameters are measures whose values are used to control the learning process of the model’s algorithm. There are multiple hyperparameters specific to each model and they limit the model’s capacity to learn the training data. While it may seem counterintuitive to hinder a model’s ability to fit the data, finding the optimal values for the hyperparameters allow the model to learn the underlying nature of the data while still being flexible enough to accommodate new data.
Within a dataset, each feature adds to the overall variance and accounts for a different dimension. Principle component analysis identifies which features are responsible for the most variance in the data, and thus contain the most information about its underlying nature. Therefore, the features that contribute smaller amounts of information about the data can be eliminated to decrease the dimensionality of the data while maintaining enough variance for the model to capture the underlying nature.
Additionally, while its not a hyperparameter per se, consider also including a measure of how long it takes the model to train and make predictions to get a grasp of its computational expense. The computation time for the model should be factored into the selection and/or optimization process. The code block below demonstrates a simple way to record the computation time for a model.
import time

start = time.time()

# Code to instantiate a model, fit it to the training data, and generate predictions goes here

end = time.time()

print(end - start)
Model Validation
In order assess the effect of different hyperparameter combinations and reduced-dimensionality on model performance, train-test splits are often employed. Randomly dividing the total dataset into a training sample (comprised of roughly 80% of the observations in the dataset) and a separate testing sample (containing the remaining 20% of the observations) allows for the model’s performance to be tested on data it did not see during the training phase. There are different measures of performance based on the model being used. But, by comparing the performance of the model on the training sample to its performance on the testing sample, the data scientist can determine evidence of overfitting and get a sense of how well the model will do if moved to production. If model performs significantly better on the training data than it does on the testing data, it suggests that the model is overfit and that the hyperparameters need to undergo more tuning. However, if there is acceptable and comparable performance of the model between the training and testing data, it can be concluded that the model will perform similarly once put into production.
Another way to ensure the measurements of model performance are genuine is to use cross validation. This process entails splitting the training data into a certain number of folds and holding out one of the folds to use as validation set while the other folds are used as the training set. This is repeated until each of the folds has been held out and then the performance scores for each of the hold outs is averaged together and used as the overall performance score of the model.
Summary
Model selection, optimization, and validation is an iterative process that no one gets right on the first try. While there is no one model that works in every situation, the process is easier if there is a general outline that you can tailor to the specific needs of a project. Based on the topics covered in this article, a general outline might resemble the steps listed below:
- Identify what problem you are trying to solve.
- If the dataset is large, consider using PCA to reduce dimensionality and computational expense.
- Split the data into a training sample and a test sample (usually with an 80:20 ratio).
- Select models that are suited for the problem you are trying to solve and assess their performance in their “vanilla” form.
- For the model that performed the best in its vanilla form, iteratively tune its hyperparameters until adequate performance measurements are achieved.
- Validate the model’s performance by comparing the training performance scores to the testing performance scores.